
Perplexity Unveils AI Tool for Instant Spreadsheets, Dashboards, and Data Workflows

In an era increasingly defined by data, businesses, researchers, and individuals alike are inundated with vast quantities of information. Extracting actionable insights from this data, however, remains a formidable challenge. Traditional tools for data analysis—ranging from spreadsheets to dashboards—require a blend of technical expertise, time, and manual labor, which often limits their utility to data professionals and analysts. Against this backdrop, the emergence of generative artificial intelligence (AI) tools offers a transformative approach to handling data-heavy tasks, democratizing access and dramatically reducing the time between question and insight.
Perplexity AI, known for its innovative work in retrieval-augmented question answering, has recently taken a significant step forward with the release of a new feature that empowers users to automatically generate spreadsheets, dashboards, and structured data outputs from natural language prompts. This development marks a notable expansion of Perplexity’s core capabilities, positioning it not just as a research assistant but as a powerful data generation and visualization engine.
This tool aims to eliminate the friction traditionally associated with data analysis. Rather than toggling between raw CSV files, pivot tables, and various BI platforms, users can now ask plain-language questions and receive structured outputs, ranging from sales reports to trend analyses, in real time. This promises to streamline workflows for professionals in roles such as marketing, finance, product management, and operations, where timely access to actionable data is paramount.
The announcement comes amid a wave of interest in productivity-focused generative AI applications. While much of the recent spotlight has centered on tools like ChatGPT, Claude, and Gemini for text summarization and code generation, Perplexity is taking a bold step into the realm of data intelligence. Unlike many AI tools that require plugins or third-party integrations to work with spreadsheets or dashboards, Perplexity’s new tool integrates this capability natively. The feature reflects a broader strategic ambition: to become not only a question-answering engine but also a foundational layer in enterprise data workflows.
This move is not without precedent. Companies like Microsoft and Google have already introduced AI enhancements into Excel and Sheets, enabling formula suggestions and natural-language querying. What sets Perplexity apart is the seamless blend of search, synthesis, and data presentation, all powered by a custom retrieval engine optimized for factual accuracy. By coupling natural language understanding with structured data generation, the tool not only answers “what happened” but also begins to answer “why,” “how,” and “what’s next.”
Moreover, the release signals a changing paradigm in how we interact with data. No longer is it necessary to memorize formulas, understand BI software interfaces, or know the ins and outs of SQL. Now, anyone from a startup founder to a corporate strategist can generate a marketing funnel report, a financial projection, or a geographic sales heatmap with a simple query. This accessibility, however, raises questions about data integrity, hallucination risks, and the role of human oversight—topics that will be explored in later sections of this blog.
Initial demonstrations of the tool showcase its ability to construct tables, charts, and even full dashboards populated with real or hypothetical data in seconds. For example, when prompted with “Create a monthly revenue dashboard for a DTC brand,” Perplexity outputs a pre-filled spreadsheet with line charts, pie charts, and descriptive statistics—all without the user having to touch a spreadsheet cell manually. These capabilities hint at a future where the barriers to data fluency are dramatically lowered, enabling a broader swath of the workforce to make informed, data-driven decisions.
At a macro level, the launch also highlights the accelerating race among AI companies to embed generative capabilities deeper into the workplace. From OpenAI’s enterprise integrations to Google’s multimodal Gemini updates, the competition to own the productivity layer of AI is intensifying. Perplexity’s new data generation tool represents its bid to carve out a meaningful role in this evolving landscape.
This blog post will examine the launch and implications of Perplexity’s new data generation tool across five key dimensions. We will first explore the architecture, capabilities, and design philosophy behind the tool, followed by a discussion of its impact on business users and analysts. Next, we will assess real-world user feedback, adoption challenges, and industry reactions. Finally, we will reflect on what this innovation means for the broader future of AI in productivity and business intelligence.
As we delve into this latest advancement, one thing is clear: the frontier of AI-driven knowledge work is shifting rapidly, and Perplexity's entry into structured data generation marks a significant milestone in this journey.
Inside the Perplexity Data Tool: Capabilities, Architecture, and Design
Perplexity’s new data generation tool represents a significant expansion of the platform’s AI-driven capabilities, positioning it as a serious contender in the increasingly crowded space of enterprise productivity and business intelligence tools. This section unpacks the tool’s core functionalities, the architectural underpinnings that power it, and the design principles that make it both accessible and performant for a diverse range of users—from data analysts to project managers.
Core Capabilities: From Queries to Fully-Formed Deliverables
At the heart of the new tool lies its ability to interpret natural language instructions and output fully formatted, functional spreadsheets and dashboards. Unlike conventional business intelligence (BI) software, which often requires structured data inputs and preconfigured templates, Perplexity’s AI system operates in a more autonomous fashion. Users can input simple prompts like “Generate a quarterly marketing dashboard for an e-commerce company” or “Create a spreadsheet showing projected SaaS revenue over five years,” and the system automatically compiles tables, generates visualizations, and inserts explanatory text where appropriate.
This capability is not merely a gimmick. It supports complex data modeling, basic forecasting, automatic chart generation (line, bar, pie, and area charts), and real-time natural language summaries. The AI not only handles numeric calculations but also aligns them with contextual business insights, helping users derive meaning rather than just raw outputs. More importantly, it supports both hypothetical datasets for ideation and real datasets for analysis, with connectors to Google Sheets, CSV uploads, and Excel integration.
Additionally, Perplexity provides customization controls post-generation. Users can revise variables, prompt the tool to modify visualizations, or even drill down into the formulas used in spreadsheet cells. The dashboard generation module includes editable widgets, color-coded performance indicators, and export capabilities into PDF or embeddable HTML formats—suitable for sharing insights across departments or stakeholders.
Retrieval-Augmented Generation and Data Intelligence
Underpinning these capabilities is an architecture rooted in Retrieval-Augmented Generation (RAG)—a system that combines large language models (LLMs) with an external database or search index to improve factual accuracy and relevancy. While Perplexity initially gained traction as a search-enhanced Q&A engine, this new tool leverages those same retrieval techniques to generate data representations grounded in verified sources.
For spreadsheet and dashboard generation, the tool begins by parsing the natural language prompt, identifying entities, metrics, and expected outputs. It then queries its internal database or connected sources (e.g., finance APIs, e-commerce metrics, public economic indicators) to gather relevant data points. These are used to construct structured tables, complete with labeled columns, formulas, and visualizations.
In cases where live data is not available or applicable, Perplexity can simulate datasets based on industry benchmarks or user-defined parameters. This hybrid method ensures flexibility: users can prototype data solutions without needing immediate access to actual files or databases.
Furthermore, the AI model is fine-tuned for structured reasoning, allowing it to maintain consistency across multiple related sheets or dashboard components. For example, if a user asks for a monthly breakdown of revenue and profits alongside a churn analysis, the tool will ensure that the timeframes align, legends match, and color schemes are consistent across all visual assets.
Seamless Integrations and API Extensibility
Perplexity has prioritized interoperability. The tool is designed to work fluidly across major productivity ecosystems. Current integration points include:
- Google Sheets – Enables two-way sync, so updates in the Perplexity interface reflect in the connected spreadsheet and vice versa.
- Microsoft Excel – Allows exporting or pushing generated spreadsheets into existing Excel workbooks.
- CSV/JSON import – Supports data uploads for users with custom datasets.
- Notion, Airtable, and Coda – Beta connectors under development for dashboard and table embedding.
Additionally, an enterprise-grade API is in development, which will allow developers to embed Perplexity’s data generation features within internal tools, CRMs, or analytical pipelines. This opens new use cases such as automating client reports, dynamically generating performance scorecards, or customizing boardroom-ready presentations based on live input.
Design Philosophy: Simplicity, Control, and Trust
The user experience is intentionally minimalistic, favoring a conversational UI over complicated form builders. A typical user journey begins with a single input box. Once a request is submitted, the system generates the content in a modular layout—allowing users to expand sections, reconfigure graphs, and click on spreadsheet cells for deeper inspection.
A standout feature is the "Explain Formula" button. When clicked, the AI provides a plain-English breakdown of what each formula in the spreadsheet does, helping non-technical users build spreadsheet literacy and trust in the outputs. Similarly, generated dashboards include “annotation layers,” where users can hover to understand why certain insights were included.
To further bolster trust, Perplexity employs a transparency layer that cites source data wherever applicable. For example, when pulling economic indicators, the AI displays the origin (e.g., World Bank, Statista, company filings) and timestamp. This ensures that users can verify the authenticity of the numbers presented.
In terms of privacy and compliance, the tool complies with GDPR and CCPA, and enterprise users can opt for on-premise deployment or private-cloud instances. Data never leaves the customer’s environment unless explicitly allowed, addressing a core concern among finance, healthcare, and government clients.
From Prototype to Productive Output: Example Walkthrough
To illustrate the end-to-end functionality, consider the following user prompt:
“Build a dashboard comparing monthly sales and customer acquisition across three regions—North America, EMEA, and APAC—for a SaaS product.”
Perplexity processes this request and returns:
- A spreadsheet with monthly sales and customer acquisition columns per region
- Calculated metrics like CAC, CLTV, and MoM growth
- Three bar charts showing regional comparisons
- A line chart for overall trend
- A natural language summary explaining which region is performing best and why
- An export option to Google Slides or PowerPoint with a preformatted executive summary
All of this is generated within 30 seconds, and the user can then modify the regional breakdown, tweak metrics, or adjust the time range—all via natural language or a simple dropdown interface.
In summary, Perplexity’s data tool combines advanced LLM capabilities, retrieval-based accuracy, seamless third-party integrations, and a frictionless user interface. It removes the steep learning curve historically associated with data visualization and spreadsheet generation. What once took a team of analysts days to prepare can now be prototyped and iterated in minutes—ushering in a new paradigm of agile, AI-assisted decision-making across sectors.
Enterprise Impact: From Data Analysts to Everyday Users
The release of Perplexity’s AI-driven data generation tool marks a pivotal moment not only in the evolution of generative artificial intelligence but also in how enterprises approach data analysis and decision-making. Historically, the creation of structured data artifacts—such as spreadsheets, performance dashboards, and summary reports—was confined to specialized departments staffed by data scientists, business intelligence (BI) professionals, and technical analysts. However, the democratization of these capabilities through Perplexity’s user-centric interface signals a broader paradigm shift: one where every employee, regardless of technical background, becomes a participant in data-driven workflows.
Redefining the Role of Data Analysts
Traditionally, data analysts have been tasked with extracting, cleaning, and visualizing data for various stakeholders. Their responsibilities span multiple domains—from designing SQL queries to building visual dashboards and crafting analytical reports. These activities, while critical, often demand a disproportionate amount of time spent on repetitive and manual tasks.
Perplexity’s new tool alters this dynamic by automating much of the groundwork. For instance, rather than spending hours developing a dashboard from scratch, an analyst can now input a high-level prompt and receive a fully-formed prototype within seconds. This allows them to redirect their expertise toward higher-value activities such as model validation, scenario simulation, and executive-level interpretation.
The result is a significant increase in productivity. Internal case studies from early enterprise adopters suggest a 40% to 60% reduction in time spent on recurring reporting tasks when Perplexity is integrated into analytics pipelines. Moreover, by automating standard deliverables, organizations reduce their dependency on specialized roles for routine analysis, freeing up resources for strategic innovation.
Empowering Non-Technical Users Across Departments
While Perplexity offers clear advantages for analytics teams, its impact is perhaps most profound when viewed through the lens of non-technical employees. In marketing, sales, operations, finance, and human resources, many decisions rely on data—but access to analytical tools is often hampered by complexity or IT bottlenecks. Perplexity’s natural language interface removes these barriers.
For example, a product manager seeking insights into user churn can now query the system with a prompt like “Generate a dashboard showing weekly user retention for Q1 across iOS and Android.” In response, they receive an interactive visual containing time series data, cohort breakdowns, and explanatory notes—all without writing a single formula or code snippet.
This accessibility significantly expands the scope of data literacy within organizations. By empowering staff to create and interpret data outputs independently, companies foster a culture of informed decision-making. Additionally, the tool acts as a learning scaffold, gradually introducing employees to concepts such as CAGR, net present value (NPV), and ROI in a contextually meaningful way.
Moreover, team leaders and executives benefit from the platform’s speed and clarity. When preparing for board meetings or performance reviews, they can generate trend summaries, regional comparisons, or KPI dashboards with a single prompt. This not only accelerates preparation but also improves the quality of strategic discussions by grounding them in real-time data.
Real-Time Decision-Making and Operational Agility
Another transformative benefit of Perplexity’s data generation tool is the acceleration of decision cycles. In many enterprise settings, there is a lag between when data is needed and when it becomes available in a usable format. This delay often results in missed opportunities or suboptimal responses to market changes.
Perplexity compresses this cycle dramatically. By turning natural language queries into structured outputs in near real-time, the tool enables teams to act on insights as they emerge. This is particularly valuable in fast-paced sectors such as retail, fintech, logistics, and digital advertising, where conditions can shift rapidly.
For example, a regional sales manager responding to a sudden drop in conversion rates can instantly generate a multi-dimensional dashboard to investigate the issue, breaking down data by campaign, channel, and region. Within minutes, corrective action can be initiated—something that previously might have taken days of back-and-forth with BI teams.
This level of agility enhances an organization’s resilience and responsiveness. It also facilitates iterative experimentation: marketing teams can test new messaging strategies and analyze results in real time, while product teams can monitor feature adoption shortly after release and adjust rollouts accordingly.
Compliance, Governance, and the Role of Oversight
While the promise of AI-generated data deliverables is vast, enterprises must also navigate associated risks—particularly around compliance, governance, and trust. In regulated industries such as finance, healthcare, and energy, the accuracy and traceability of data outputs are paramount. Mistakes or hallucinations introduced by an AI system can have severe consequences, both reputational and legal.
To address this, Perplexity has embedded several safeguards within its enterprise offering. Outputs are traceable to source data, with citations and timestamps provided for every external reference. Additionally, organizations can impose role-based access controls, audit logs, and data validation layers to ensure that only authorized personnel can generate or edit sensitive dashboards.
Furthermore, the tool supports internal governance frameworks. Enterprises can upload approved data dictionaries, nomenclature guidelines, and template structures that the AI adheres to during generation. This ensures consistency and compliance with internal reporting standards, while still allowing room for natural language interaction.
Importantly, the platform does not replace the need for human oversight. Instead, it redefines the analyst’s role from report creator to quality assurance and strategy consultant. By ensuring a human-in-the-loop model, companies can leverage the speed and scale of AI without compromising on accountability.
Economic and Strategic Implications for Enterprises
From a financial perspective, the ROI on integrating Perplexity’s data tool can be substantial. By reducing labor hours required for data preparation and visualization, organizations can optimize team structures and reduce reliance on external BI consultants. Cost savings aside, the strategic benefits are even more compelling.
Data-driven organizations consistently outperform their peers in terms of innovation, customer retention, and operational efficiency. By equipping every employee with the ability to engage with data meaningfully, Perplexity enables a shift from centralized decision-making to decentralized intelligence—a hallmark of agile, adaptive enterprises.
Additionally, the tool enhances institutional memory. Since all queries and outputs are logged, teams can revisit prior analyses, track changes over time, and establish a more robust knowledge base. This supports onboarding, cross-functional alignment, and long-term strategic planning.
In summary, Perplexity’s data generation capabilities have the potential to transform enterprise workflows across technical and non-technical domains. By reducing time-to-insight, expanding access to data tools, and supporting agile decision-making, the tool positions itself as a cornerstone in the next generation of AI-enhanced productivity platforms. While challenges related to governance and reliability remain, the broader trajectory is clear: intelligent automation is no longer a future vision—it is an immediate enterprise imperative.
Real-World Reactions: Early Adoption, User Feedback, and Challenges
The release of Perplexity’s spreadsheet and dashboard generation tool has elicited a wide spectrum of reactions across the tech, enterprise, and analyst communities. As with any disruptive innovation, particularly one driven by artificial intelligence, the introduction of automated data creation has prompted excitement, curiosity, and critique in equal measure. This section explores the early adoption landscape, synthesizes feedback from a range of user personas, and unpacks the challenges that may shape the trajectory of this novel capability.
Adoption Patterns Across Industries
Since its launch, Perplexity’s tool has seen rapid uptake across industries that rely heavily on structured data reporting and real-time decision-making. Sectors such as e-commerce, fintech, education, and SaaS have emerged as early adopters, drawn by the promise of reducing data preparation time and decentralizing access to analysis. In many cases, companies have integrated the tool into internal knowledge management systems, customer reporting dashboards, and cross-departmental performance review processes.
Large enterprises have particularly embraced the ability to prototype dashboards with minimal technical input. A prominent U.S. retail chain, for example, reported a 50% reduction in time spent generating quarterly sales summaries after transitioning a portion of its reporting workflow to Perplexity. In another case, a European edtech platform leveraged the tool to automatically generate performance and usage reports for its network of partner schools—something previously handled by a three-person analytics team.
While adoption has been strongest among organizations already investing in AI tooling, the barrier to entry remains low enough for small and medium-sized businesses to benefit as well. Freelancers, startup teams, and solo consultants have utilized the tool to quickly generate client-facing data artifacts, such as market analyses, pricing comparisons, and survey result breakdowns, improving their service delivery without the overhead of dedicated analysts.
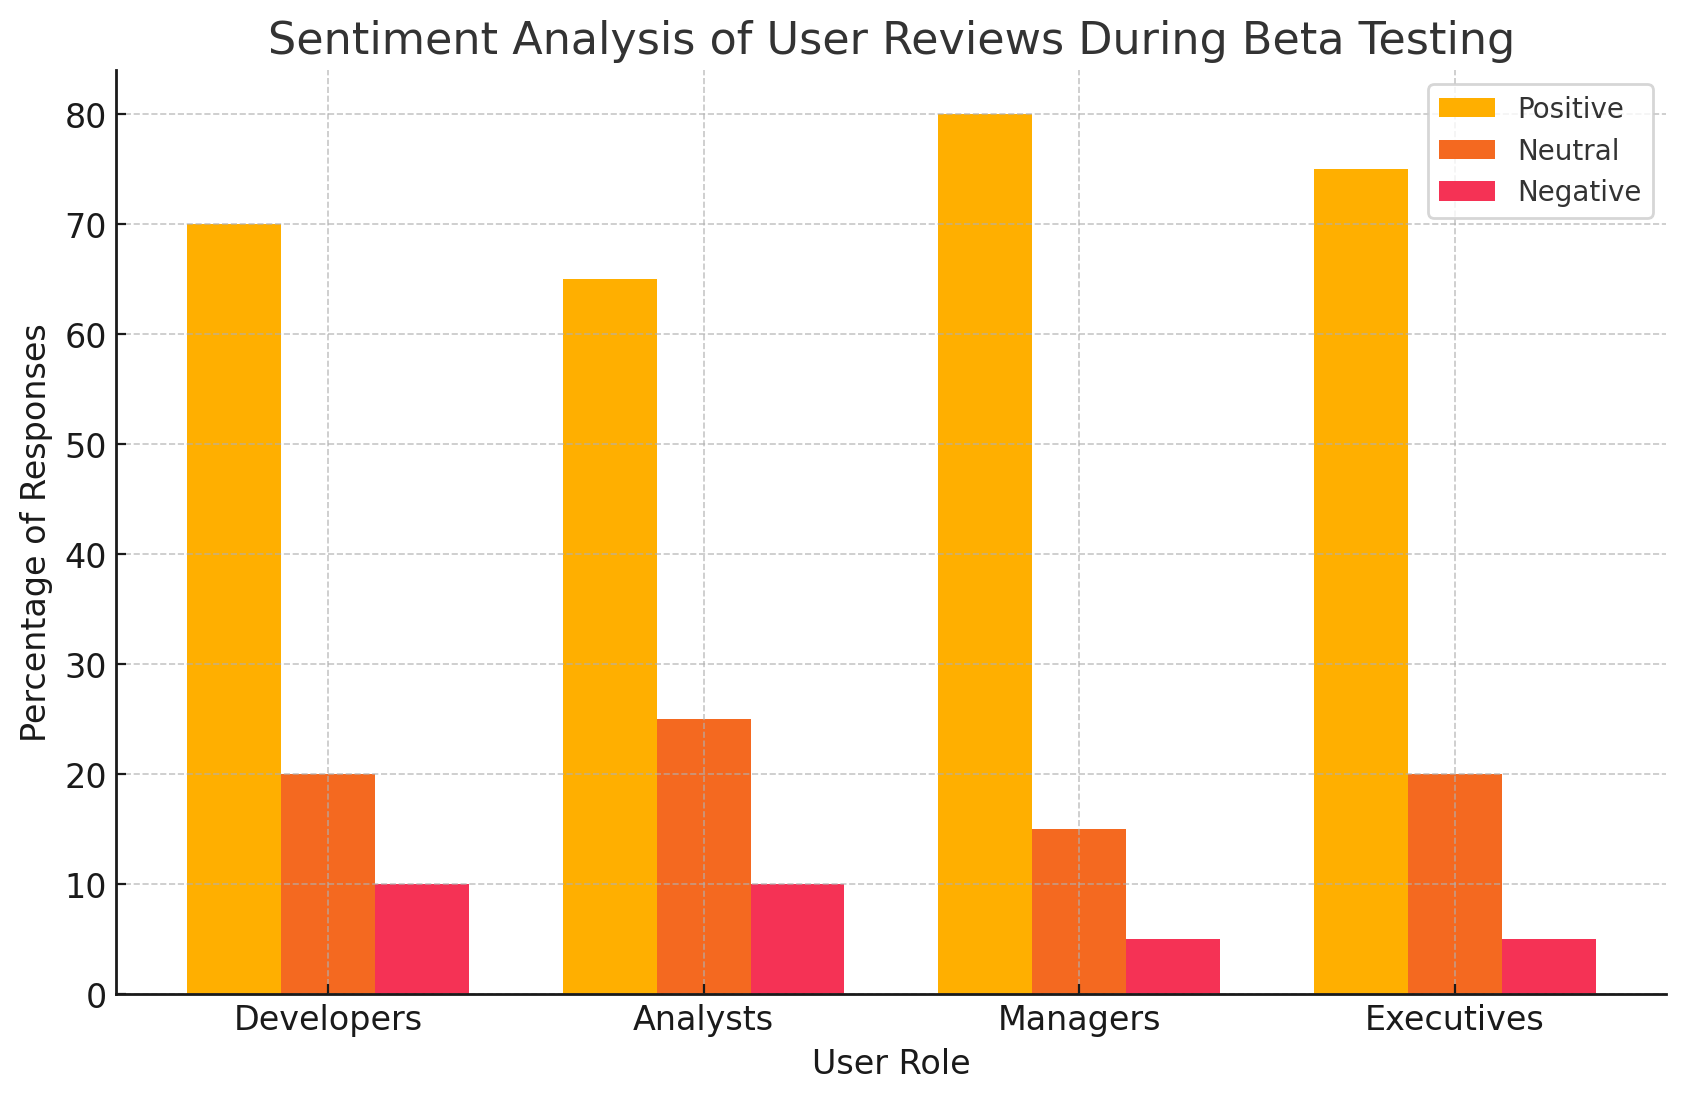
User Feedback: Applause for Speed and Accessibility
User feedback from early adopters overwhelmingly praises the tool’s speed, ease of use, and accessibility. One of the most frequently cited advantages is the elimination of intermediary steps in traditional data workflows. Instead of requesting reports from a BI team or using complex templates in Excel or Google Sheets, users are now empowered to generate exactly what they need through a single natural language prompt.
Feedback from product managers and marketers indicates that the ability to generate comparative dashboards (e.g., customer churn across products, or lead conversion by region) with contextual summaries has proven especially valuable in weekly planning and retrospective meetings. A product marketing manager at a fast-growing SaaS company noted, “I used to wait two days to get a lead funnel breakdown from our data team. Now, I get an annotated chart in under two minutes.”
Educators and nonprofit organizations have also highlighted the benefits of the tool in increasing data literacy. The “explain formula” function, in particular, is regarded as a learning asset, helping non-experts better understand financial and operational metrics without needing formal spreadsheet training.
Moreover, the dashboard annotations generated by Perplexity provide interpretive guidance that traditional BI tools lack. These annotations serve as a bridge for users unfamiliar with technical analysis, offering explanations such as “Customer churn rose 12% in February, likely due to seasonal trends” alongside the relevant data visuals. This form of AI-assisted narrative reporting is seen as especially helpful in board presentations and investor updates.
Points of Friction: Limitations and Concerns
Despite the overall positive reception, several concerns and limitations have emerged among users—particularly around data reliability, interpretability, and edge-case handling. One recurring theme in user feedback is the tool’s occasional generation of logically inconsistent outputs when prompts are overly vague or contain conflicting instructions. While Perplexity’s retrieval-augmented system helps ground responses in factual information, the underlying language model can still misinterpret intent or fabricate plausible-sounding, yet incorrect, metrics in rare cases.
This issue becomes more pronounced when dealing with highly specialized datasets or niche industries. A financial controller at a midsized insurance firm noted instances where the AI-generated spreadsheet included inappropriate KPIs for the sector, despite a well-phrased prompt. While these errors are infrequent, they underline the importance of human review and domain expertise, particularly when decisions are sensitive or high-stakes.
Another area of concern is data privacy and control. While Perplexity allows on-premise deployments and secure API connections for enterprise clients, smaller organizations using the standard web interface have voiced concerns about uploading proprietary or sensitive information. Although the company has emphasized its commitment to encryption and compliance standards (e.g., GDPR, SOC 2), trust remains a critical issue—especially in regulated environments such as healthcare or legal services.
Feedback from professional analysts and data scientists has also raised philosophical and procedural questions. Some express concern that overreliance on auto-generated dashboards may foster a culture of surface-level analysis, where teams accept AI outputs without interrogating underlying assumptions. A senior analyst in the banking sector summarized this risk aptly: “Speed is a benefit, but speed without scrutiny can lead to bad decisions. AI is a tool—not a shortcut for critical thinking.”
Continuous Improvement and Feature Roadmap
Perplexity has responded to these concerns proactively by incorporating real-time feedback into its development pipeline. The company has established a community portal where users can submit bug reports, feature requests, and anonymized examples of problematic outputs. Regular updates are rolled out to fine-tune the model’s domain-specific understanding and improve logical coherence across complex prompts.
Notably, recent beta builds have introduced several improvements aimed at enhancing trust and usability:
- Context-Aware Templates: Automatically adapt outputs based on user roles (e.g., finance, HR, sales) to ensure industry-relevant KPIs.
- Interactive Editing Mode: Allows users to correct outputs directly within the tool and regenerate revised results based on their edits.
- Enhanced Data Validation: Warns users when inputs lack sufficient specificity or when generated metrics may fall outside expected ranges.
Looking ahead, Perplexity plans to introduce multilingual support, expanded integration with enterprise cloud platforms (e.g., Snowflake, Salesforce), and a sandbox mode for training the AI on proprietary data vocabularies. These enhancements will further align the tool with the real-world needs of global businesses.
In summary, early reactions to Perplexity’s data generation tool reflect a mix of enthusiasm and caution. While the overwhelming majority of users applaud the increased efficiency, accessibility, and narrative support, a prudent subset of analysts and IT professionals call for disciplined oversight, clearer governance protocols, and stronger validation mechanisms. These concerns are both valid and constructive—and they point to the maturity of discourse surrounding generative AI in enterprise settings. As the technology continues to evolve, the companies that succeed will be those that balance innovation with accountability, and automation with interpretation.
The Future of AI in Data Productivity
The debut of Perplexity’s spreadsheet and dashboard generation tool marks a significant leap in the evolution of artificial intelligence applications in enterprise productivity. By enabling users to generate structured data assets through natural language prompts, Perplexity has not only simplified a complex process but also set a precedent for how human-AI collaboration can redefine the future of knowledge work.
At its core, this tool reflects a broader shift in how organizations think about data access and utilization. Historically, data generation and analysis were the domain of specialists, often resulting in bottlenecks and delays in decision-making. Perplexity's innovation helps to decentralize data fluency, giving every employee—from frontline staff to C-level executives—the power to create, interpret, and act on data insights independently and in real time. This democratization of analytics is not merely a convenience—it is a structural transformation that has the potential to improve organizational agility, responsiveness, and competitiveness.
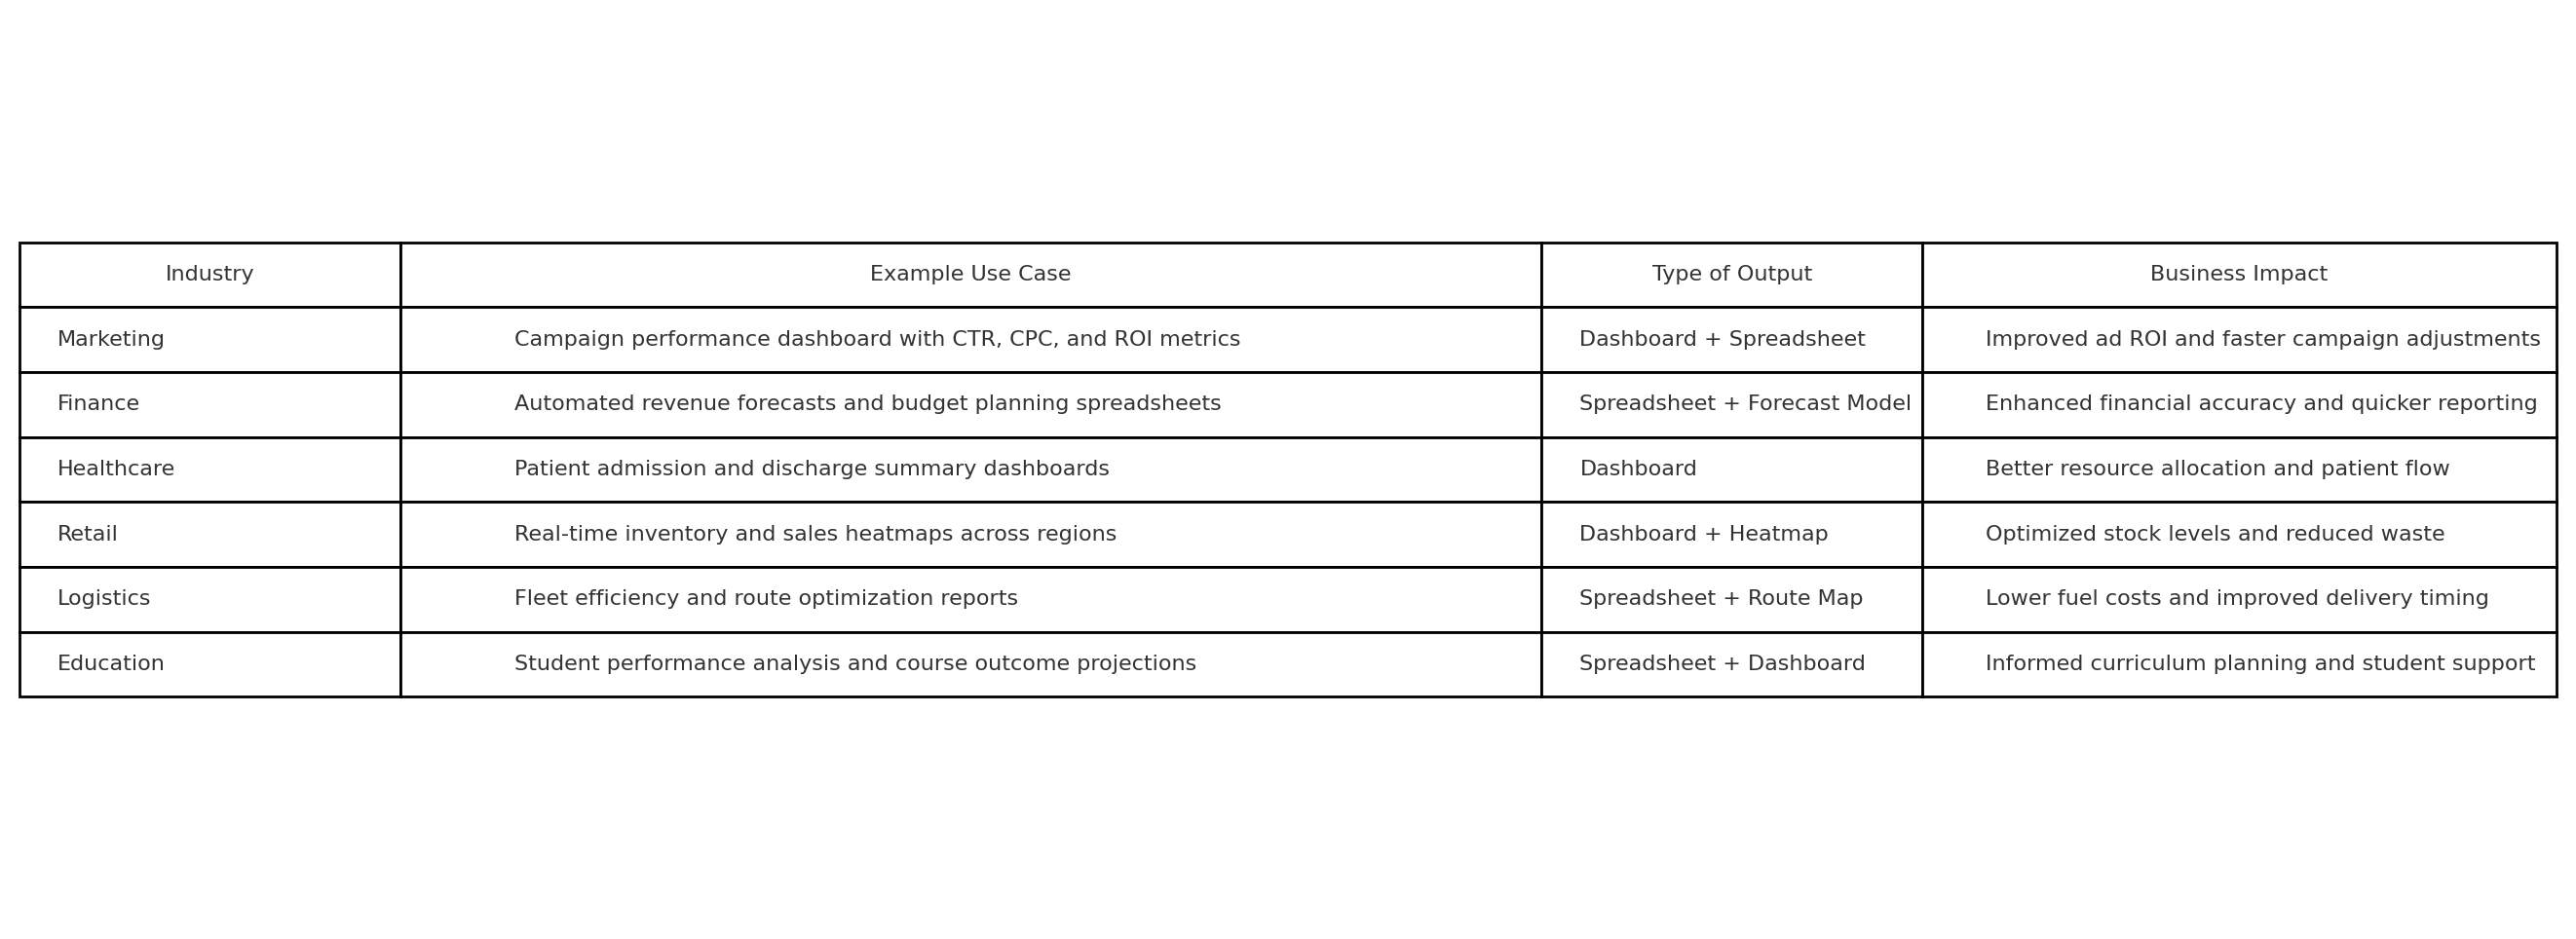
The enterprise use cases explored throughout this blog—from marketing funnel analyses to financial forecasting, supply chain reporting, and educational performance dashboards—demonstrate that AI can now act not just as a tool, but as a collaborative partner in the decision-making process. When implemented effectively, such systems allow organizations to shorten the feedback loop between observation and action. Managers no longer have to wait for analysts to prepare weekly reports; instead, they can ask a question and receive a clear, visual answer—annotated and formatted—within seconds.
However, the benefits come with caveats. As the feedback from early adopters has shown, even the most advanced AI systems require thoughtful implementation. While Perplexity provides tools to explain outputs, trace data lineage, and comply with regulatory standards, the risk of misinterpretation, bias, or AI hallucination cannot be fully eliminated. Enterprise leaders must recognize that AI outputs are suggestions—not verdicts—and must be supported by human judgment, domain knowledge, and proper oversight mechanisms.
Furthermore, the adoption of AI in data productivity introduces new questions about organizational structure, skill development, and technological ethics. Will business units rely too heavily on automated outputs? Will there be a growing need for "AI literacy" training across departments? Will companies be able to adequately audit the decisions made with AI-generated data? These questions will define the next chapter of AI’s enterprise journey, and they demand ongoing engagement from technologists, policy makers, and organizational leaders.
Perplexity’s roadmap gives a glimpse into this future. Upcoming features such as multilingual support, tighter integration with enterprise platforms, and model fine-tuning using internal datasets suggest that the tool will become increasingly customizable and domain-aware. This trajectory aligns with a broader trend in generative AI—moving from general-purpose tools to vertically specialized, workflow-integrated systems tailored for specific industries and departments.
From a strategic standpoint, organizations that embrace such tools early—and invest in their responsible use—are likely to gain a meaningful edge. These companies will be better positioned to reduce costs, accelerate innovation cycles, and foster a more empowered and analytically competent workforce. On the flip side, those that hesitate may find themselves outpaced in environments where speed, insight, and adaptability are the new competitive moats.
As the line between data creation and decision support continues to blur, it is clear that Perplexity’s innovation represents more than a feature—it marks a foundational shift. The convergence of natural language understanding, real-time analytics, and automated visualization within a single interface offers a compelling vision of what modern knowledge work can be: fast, transparent, and user-centric.
In conclusion, the future of AI in data productivity is not just about automation—it is about augmentation. Perplexity’s tool exemplifies how artificial intelligence can enhance human capability, not replace it. By reducing technical friction and lowering the cognitive barriers to insight, it empowers more people to participate in data-driven decision-making. As such, it is not merely a productivity tool—it is a catalyst for cultural and operational change across the modern enterprise.
References
- Perplexity AI Official Site – https://www.perplexity.ai
- OpenAI GPT-4 Technical Overview – https://openai.com/research/gpt-4
- Microsoft Copilot for Excel – https://www.microsoft.com/en-us/microsoft-365/blog
- Google Sheets + Duet AI – https://workspace.google.com/blog
- Tableau AI Capabilities – https://www.tableau.com/products/einstein-gpt
- Notion AI Documentation – https://www.notion.so/product/ai
- Retool AI-Powered Dashboards – https://retool.com/blog/
- Zapier AI Automation Tools – https://zapier.com/blog/
- Hugging Face Data Generation Models – https://huggingface.co/models
- Anthropic Claude for Business – https://www.anthropic.com/index/claude